
Click the 'Jump Profile' toolbar button ( ),
select 'Profile' from the 'Jump' menu or double-click the Jump Profile Preview
to show a graphical display of the logger date for the
currently selected jump.
To zoom into the jump profile chart, pull up a rectangle to the lower right with the left mouse button pressed. Zoom out by pulling the rectangle up to the upper left. Pan the chart by pulling the chart with the left mouse button and ALT key pressed. Use the mouse wheel or PAGE UP/PAGE DOWN to scroll from one jump to the other while viewing the jump profile chart.
Freefall speeds can be displayed as TAS
or SLAS. While TAS
displays the speeds as they were measured, SLAS
recalculates the speeds based on the current altitude so speeds at different
heights can be better compared. Please see Gary Peck's excellent article
'Skydiving Fall Rate' for details.
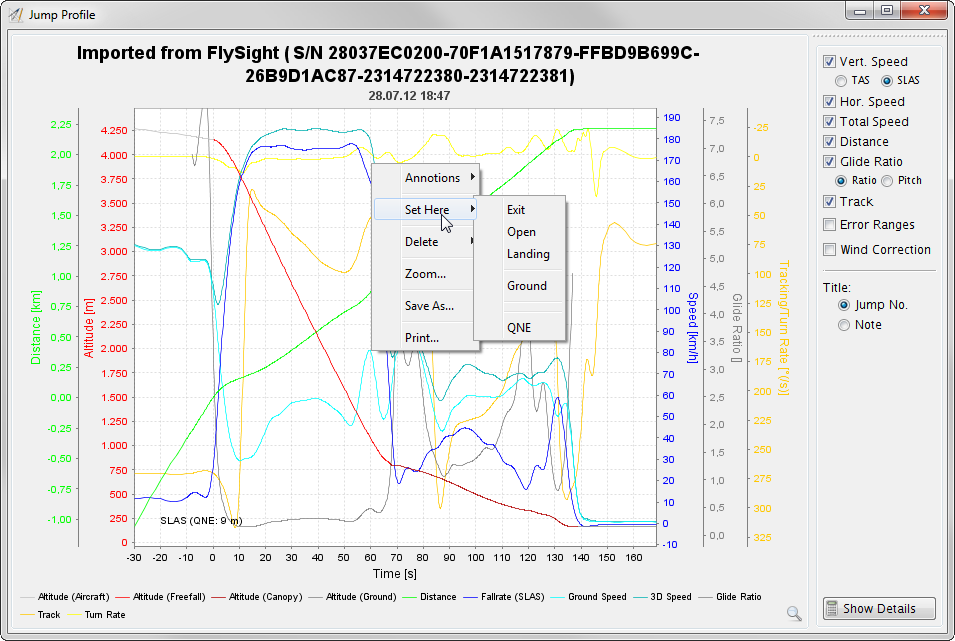
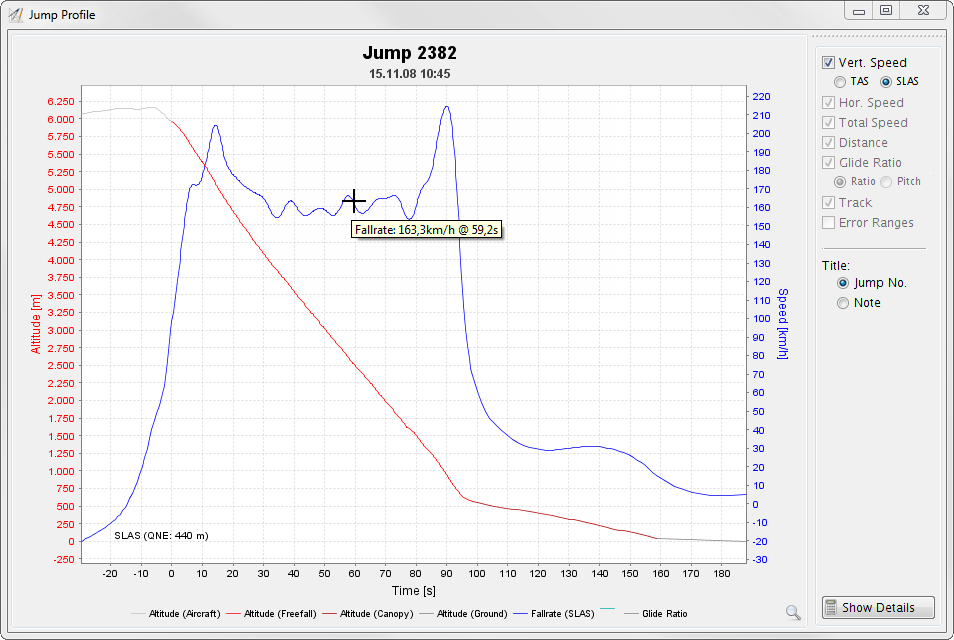
When you right-click into the chart a popup menu allows you to save and print the chart, to delete parts of the track and to manually edit key data points. Hovering the mouse one of the curves will display the value at this point.
Depending on the data source, the chart shows more or less information for the jump: For barometric loggers, the chart shows height and fall rate vs. time; for GPS, the chart additionally shows horizontal distance and speed over ground, combined 3D speed along the glide path, glide ratio (as ratio or pitch) and course and turn rate. These curves can be turned on and off via the check boxes to the right of the chart. Tracks loaded from a FlySight can additionally show the recorded accuracy estimates. Tracks loaded from a GPS can be corrected for wind influcence.
Click the 'Show Details' button in the lower right corner to see more details for this profile.

