 )
or select 'Charts' from the 'Tools' menu to open a dialog which
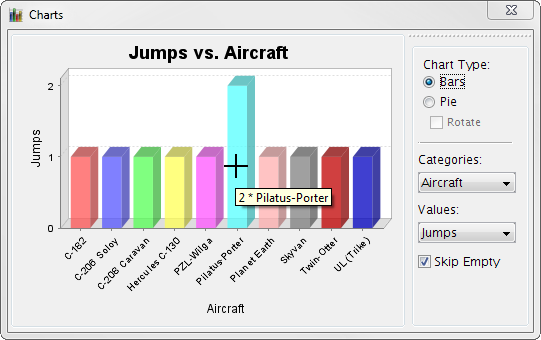
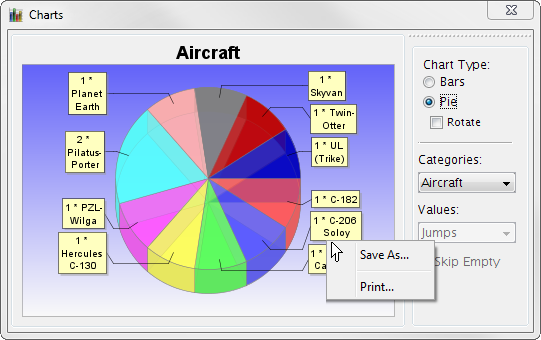
displays several charts based on your logbook.
)
or select 'Charts' from the 'Tools' menu to open a dialog which
displays several charts based on your logbook.Click the 'Charts' toolbar button ( )
or select 'Charts' from the 'Tools' menu to open a dialog which
displays several charts based on your logbook.
To zoom into the chart, pull up a rectangle with the left mouse button held to the lower right. Zoom out by pulling the rectangle up to the upper left.
Hover the mouse over one of the bars/slices to display details for this value.
Right-click the chart to display a popup-menu to save or print the chart.

